.png)
Exploration data reflects the circumstances of its collection. Some surveys are captured with the precision of modern instruments, while others bear the limitations of older methods or challenging field conditions. The result is information that remains valuable but often incomplete and inconsistent when combined in a single project.
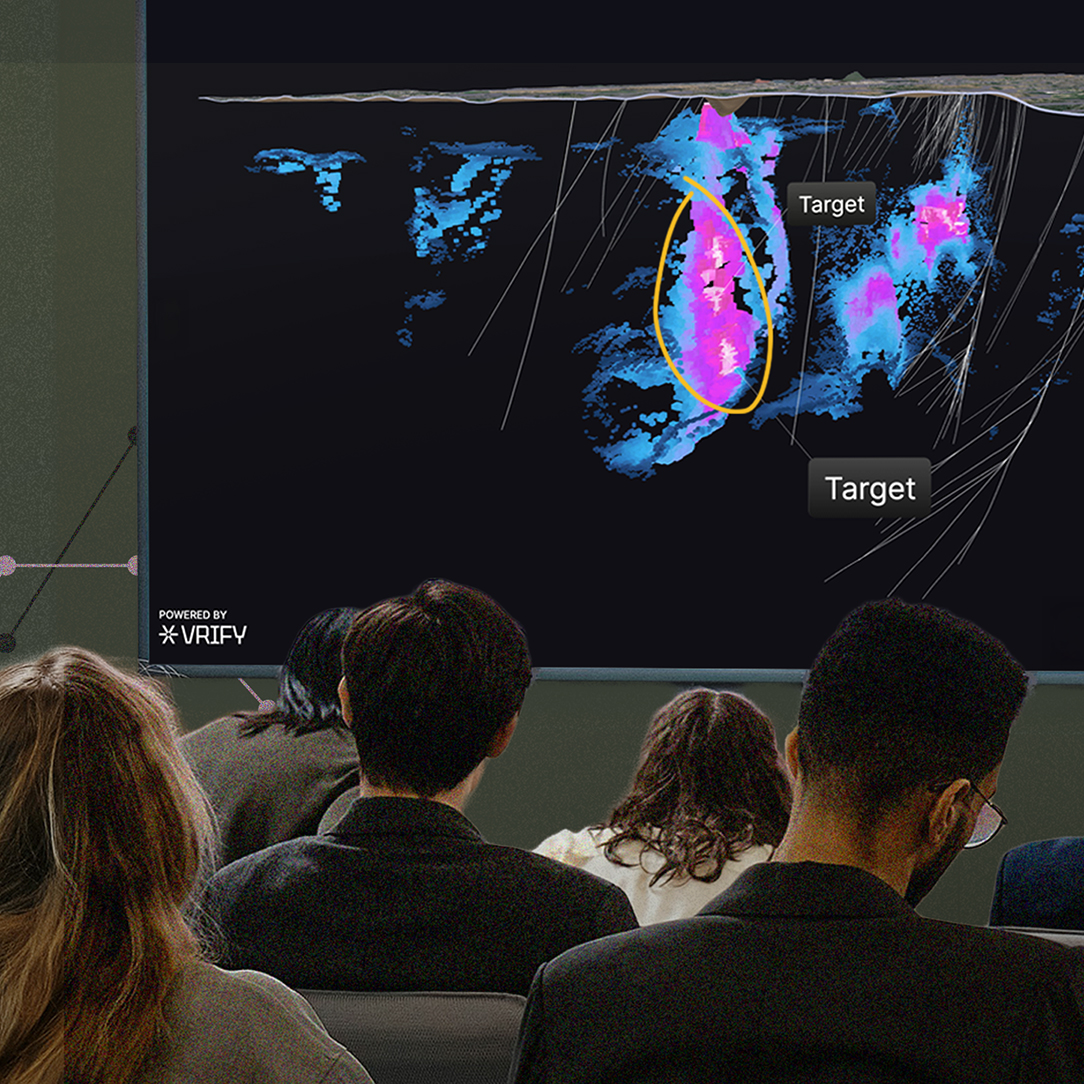
This variability is the environment in which DORA is applied, and where it stands out. The software turns diverse datasets into exploration targets quickly and at scale, grounding each prediction in geological context with clear reasoning and confidence levels. Because the quality of these outputs depends largely on that of the inputs, disciplined data preparation becomes one of the first steps in effectively using DORA.
For many of our partners, this stage can be particularly demanding. The work is detailed and often falls outside the mandate of external consultants. At VRIFY, a dedicated team of geophysicists supports this stage, ensuring clients’ datasets are ready for the software so that the focus remains on target generation.
Data Standardization and Transformation
This effort extends beyond file compilation and conversion, into steps that ensure comparability across the same ground. Currently, as DORA ingests data in 2D, geophysical inputs are first transformed into rasters. Point and line measurements are interpolated into grids that cover the area of interest, while sections from inversion models are extracted at different elevations, capturing changes in geological domains and contacts with depth. Where methods of similar resolution overlap, in-house scripts merge and level data to produce seamless layers, maximizing continuous information coverage. Interpreted products are carried further: Electromagnetic picks and lineaments can be converted into distance-to-conductors layers and, where conditions support it, developed into strike-field maps that can highlight structural patterns.
Data Augmentation
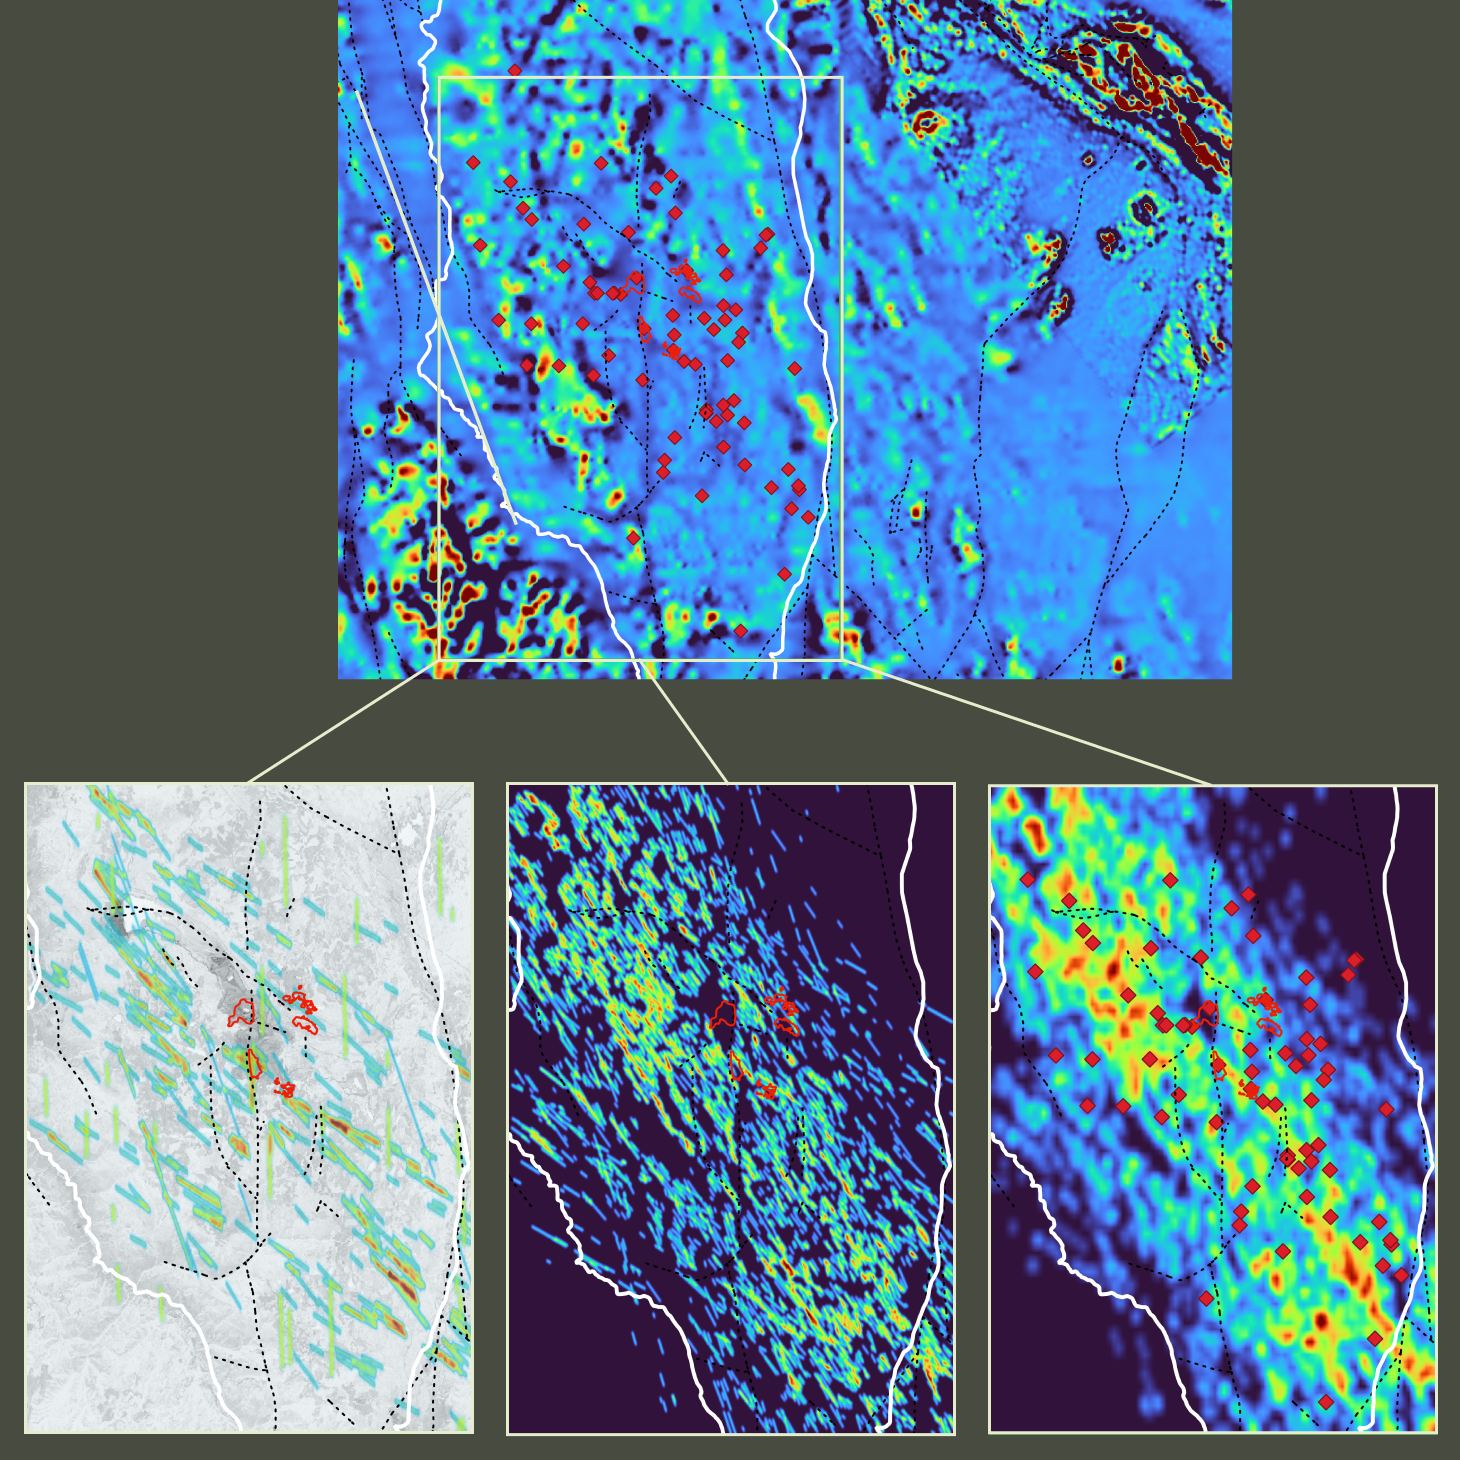
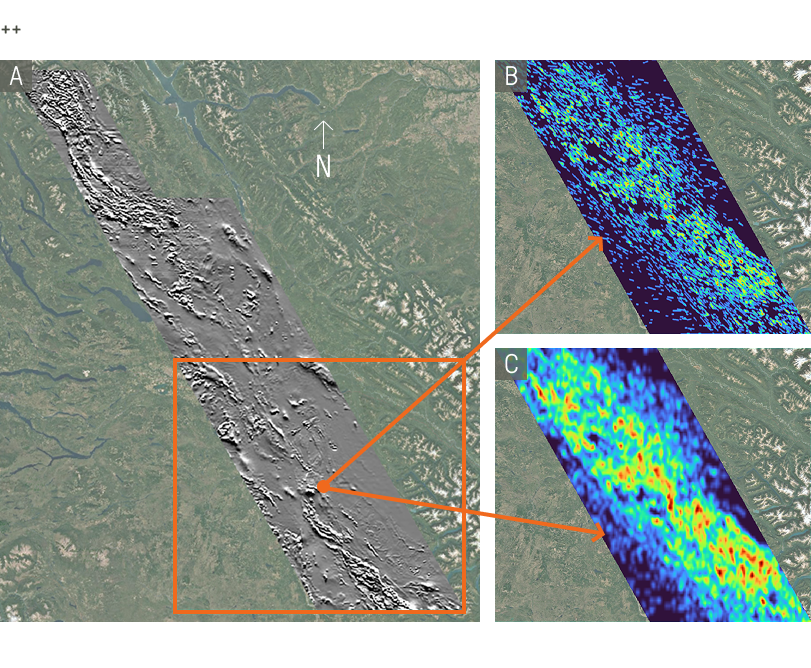
Once datasets have been standardized and transformed, attention shifts to signal enhancement. Potential field data, such as magnetics and gravity, are processed using a suite of Fourier filters, which are mathematical tools that amplify or attenuate certain frequencies and highlight edges and boundaries (Figure 1). They help remove noise where present, while revealing subtle signals and sharpening the expression of structural fabric that might otherwise remain muted. Additional refinement is achieved through machine-learning routines, including inpainting (Figure 2), which is a gap-filling script that restores coverage where data is missing due to cultural noise. Finally, lineament mapping is conducted (Figure 3), which adds potential geological context detail in areas with weaker signal.


Not all geophysical survey files arrive in a standard form, and in these cases our team develops tailored solutions to make them usable. For example, on one project, magnetic data available only as RGB imagery was converted into a workable grid through a script designed to approximate values from pixels. Public government surveys are also integrated as needed, adding regional perspective that complements proprietary information and helps connect shallow features seen in local rasters with deeper, larger-scale structures.
In addition to supporting data preparation for DORA, our Geophysics Team highlights gaps that may remain. By making these absences clear, we help our partners plan exploration campaigns that address missing data and improve future predictions.
Through this careful preparation, we empower exploration teams with datasets that are more complete and coherent for analysis, giving DORA a stronger base to generate defensible targets. If you have questions about preparing data for DORA or the overall onboarding process, book a demo with our Geoscience Team.
<hr/>

.png)


.jpg)

.png)